experimental data acquisition
Calibrate an automatic polarimeter with
deionized water. Rapidly dissolve a precise mass of α-D-glucopyranose in a
precise volume of deionized water using a magnetic stirrer. When complete,
transfer the solution to a polarimetry tube and place it inside the
polarimeter. Register optical rotation as a function of time. Repeat the
experiment using a dilute NaOH solution as solvent, instead of deionized water. model prescription
Figure 1 represents a generally accepted
catalised mechanism for C-1 reconfiguration on D-glucopyranose. This reaction
interconverts the α anomer (abbreviated αDg) and the β anomer
(abbreviated βDg) and it requires a Brönstead acid (proton donor) and a
base; several acids and bases catalyse this reconfiguration with different
effectiveness. Each elementary step in the mechanism of Figure 1 includes only
one intermediate species or an intermediate species and a non-intermediate
species (reactant, product or catalyst), whatever the reaction direction
considered. This is a kind of a linear pathway in the intermediate species,
generally represented in equation 1, with possible co-reactants of A and
co-products of B (a catalyst is both a co-reactant and a co-product). If the
intermediates remain at trace levels throughout the reaction then the rate for
this simple pathway topology is well approximated by equation 2 [1]. This is a
pseudo-first order rate equation where the rate coefficients Φ1 and Φ–1 combine the rate
constants of all reactions in the mechanism (forward and reverse) as well as
concentrations other than [αDg] and [βDg]. In fact, several simple
pathways are expected to be working simultaneously between αDg and
βDg depending on the acid and base catalysts present. For example, in pure
water there are always the acids H3O+ and H2O
and the bases Concentration changes can be followed by
polarimetry since both anomers are optically active with different specific
rotations, [α], at 20 ºC and 589
nm: [α]αDg =
+112.2º g–1 cm3 dm–1 and [α]βDg = +18,7º g–1 cm3
dm–1 [2]. The observed polarized light plane rotation, α, is the sum of the rotations
caused by each anomer, equation 4, which depends on the anomer concentrations
(g cm–3) and on the length L
(dm) of the solution. By working out the necessary replacements between
equations 3 and 4 (also using the mass balance mentioned above) it can be shown
that the time change of the observed rotation is given by equation 5, where α0 is the zero time
rotation (only αDg present) and αeq
is the rotation at equilibrium. Equation 5 has four adjustable parameters, Φ1+Φ–1, α0
and αeq, to fit data
(t, α). Equation 5 can be linearized in its
variables by applying logarithms to both members, equation 6. Fitting to a
straight line, however, requires knowing the precise value of αeq. This can be
obtained experimentally by allowing the reaction to reach equilibrium but for a
short class (1-2 hours) it is preferable to also estimate αeq by nonlinear regression since the uncatalysed
reaction takes more than two hours to reach equilibrium. |

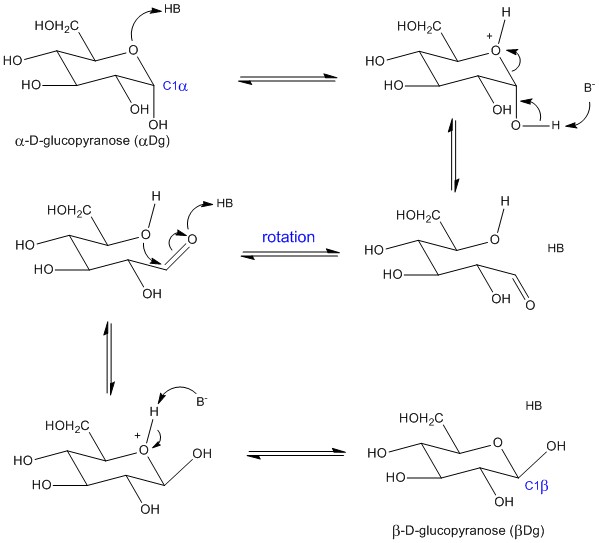
Figure 1 – Possible
acid-base catalysis mechanism for the anomeric
reconfiguration of D-glucopyranose between the αDg and βDg C-1 diastereomers. The
arrows for electron movement are only for the forward direction but the pathway
is reversible. The mechanism uses only one acid-base conjugated pair, HB/B-,
but it works the same with any number of acid-base pairs. 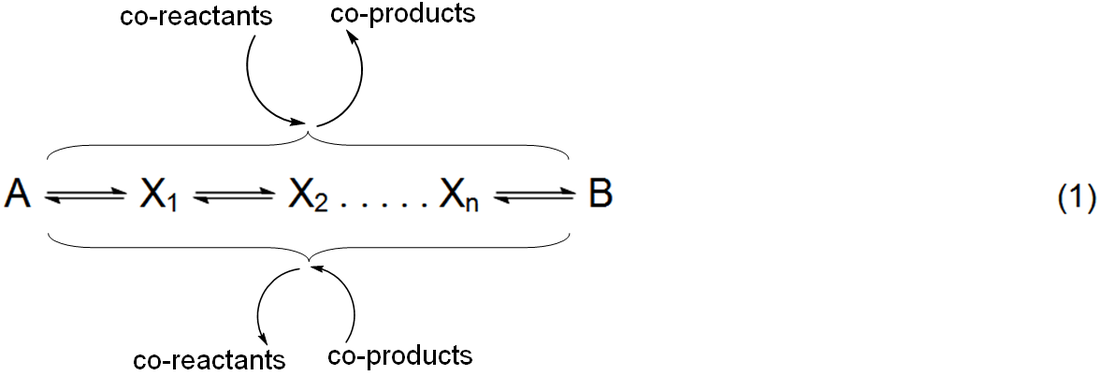


|
computational function
Matlab files can be downloaded using the links
at the bottom of this page. Function mut.m is a
simple implementation of the Matlab function nlinfit.m which
estimates the parameters of equation 5 by nonlinear least squares fitting.
Also, the Matlab functions nlparci.m and ttest.m are used to calculate,
respectively, the uncertainty associated with the estimated parameter values
and the Student-t statistic for the residue sample against a normal
distribution of samples with mean zero. The code can be inspected with any word
processor and run in the Matlab console window using
a command like:
mut(datavariablename, [α0,
αeq,
Φ1+Φ–1], 'namestring', o )
where datavariablename
is the name
of a variable in the Matlab
workspace containing values for the experimental variables (see sample file below). The second argument
of mut.m is
a vector of initial values for the adjustable parameters (example: [21.5, 10, 0.1]) and the last argument,
o, is set to 1 to perform regression or 0 to just plot
data points and function curve using the initial parameters.
This last option is useful
to manually adjust the initial parameter
values and see the effects
on the theoretical
function. After a good initial parameter
vector is found by trial and
error the nonlinear fitting process is much
more likely to converge.
examples and discussion
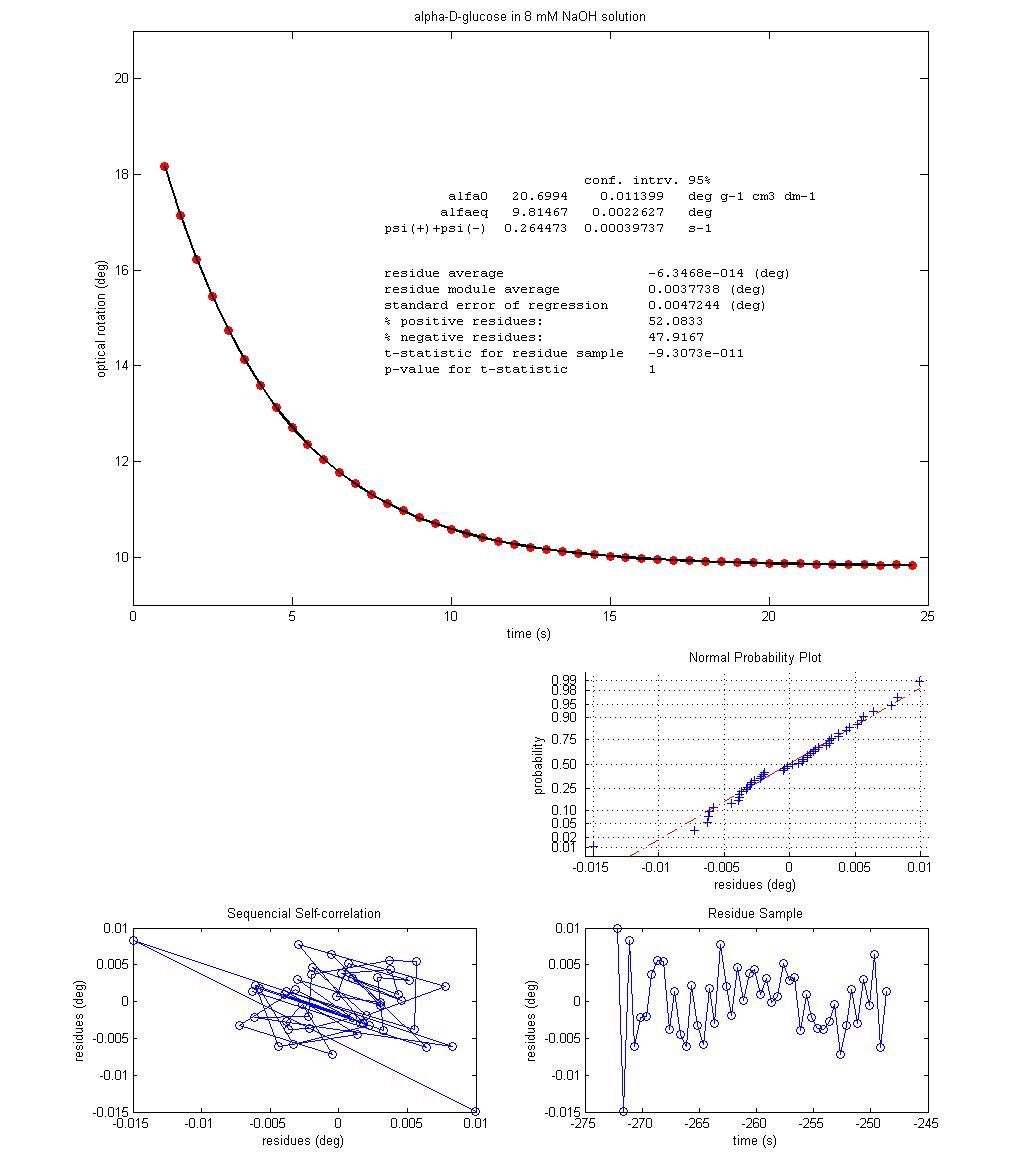
Figure 2 shows the best fit of equation 5
over experimental data obtained in class, with and without NaOH.
The almost perfect fit in both cases supports the mechanism and the
corresponding kinetic description proposed, as well as the assumptions made.
Nevertheless, it does not prove it because other forms of exponential decay
functions, with other parameters, may fit the same data as well. Values for the
extreme rotations α0
and αeq
are very similar in both cases although the OH–-catalysed experiment
is about ten times faster, as demonstrated by the estimated values for Φ1+Φ–1. Since a catalyst does not change equilibrium
concentrations the similar results for αeq suggest that
α0 = [α]αDg [αDg]0
L
and using the α0 value estimated for the uncatalysed
reaction (dissolution time is less important for a slower reaction) then
[α]αDg = 21.0/
(0.10 x 0.96) / 2 = +109º g–1 cm3 dm–1
at
25 ºC, which is not far from the published value of +112.2º g–1 cm3
dm–1 at 20 ºC.
All
statistical indicators suggest an excellent agreement between experimental data
and theoretical description.
Figure 2 – Optical rotation change with time at 25 ºC for two

|
references [1]
Helfferich, FG (2001). Chapter 6 - Practical Mathematics of Multistep Reactions, In: F.G. Helfferich, Editor(s), Comprehensive Chemical Kinetics, Elsevier,
2001, Volume 38, 119-131. DOI: 10.1016/S0069-8040(01)80027-3
[2]
https://www.sigmaaldrich.com/content/dam/sigma-aldrich/docs/Sigma/Product_Information_Sheet/2/g7528pis.pdf (Jan-2017) |
| ||||
