experimental data acquisition
A solution of a
self-complementary DNA oligonucleotide is made with known concentration in a
buffer containing NaCl. This solution is transferred
to a quartz cuvette and inserted in a temperature-controlled holder inside a UV
spectrophotometer set to 260 nm, the characteristic UV maximum extinction
coefficient of DNA. The
zero absorbance is previously set with the buffer solution. A typical classroom
experiment starts by heating the sample to the maximum convenient temperature
and registering the absorbance after stabilization. Temperature is decreased in
steps of 2 or 3 ºC to the desired final value. After each temperature change,
stabilization of absorbance is graphically monitored using a kinetics method.
Do two experiments with different NaCl
concentrations. model prescription
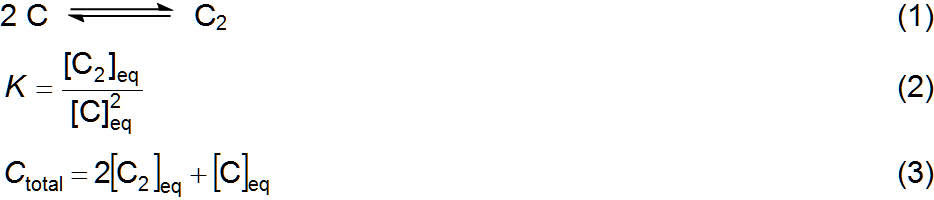
The melting, or denaturation, of double
stranded DNA is a chemical equilibrium shift towards strand separation caused
by an increase in temperature [1]. For self-complementary DNA this can be
written as equation 1. Symbol C designates single stranded DNA (unpaired) and C2 double stranded DNA (paired); Ctotal is the total
concentration of strands, paired or unpaired. This is a simple two-state,
all-or-nothing model that does not consider other possibilities besides the
complete Watson-Crick pairing between self-complementary strands, which is a
reasonable assumption if the oligonucleotide is relatively short. The
equilibrium constant and material balance corresponding to chemical equation 1
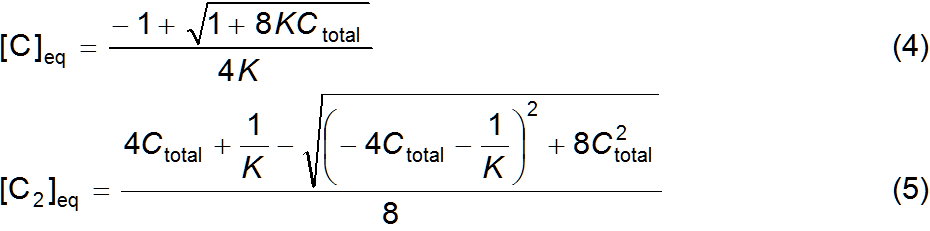
are expressed in equations 2 and 3, respectively. Substitutions between these
two equations enable to express [C]eq and [C2]eq
as functions of Ctotal and K, equations 4 and 5. The signs of the
square roots in the quadratic formulas were chosen so that [C]eq and [C2]eq are always real, positive numbers such
that [C]eq ≤ Ctotal and
2[C2]eq ≤
Ctotal. The DNA strands pairing/unpairing process caused by temperature changes is easily
followed by UV spectrophotometry at 260 nm [2] because single strands are
characterized by a higher extinction coefficient at that wavelength than double
strands. This is known as a hyperchromic effect [3].
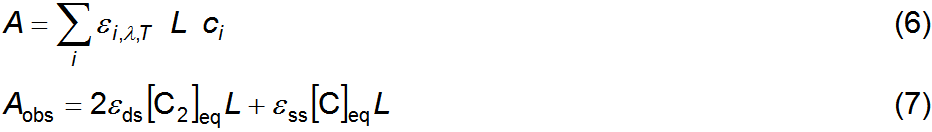
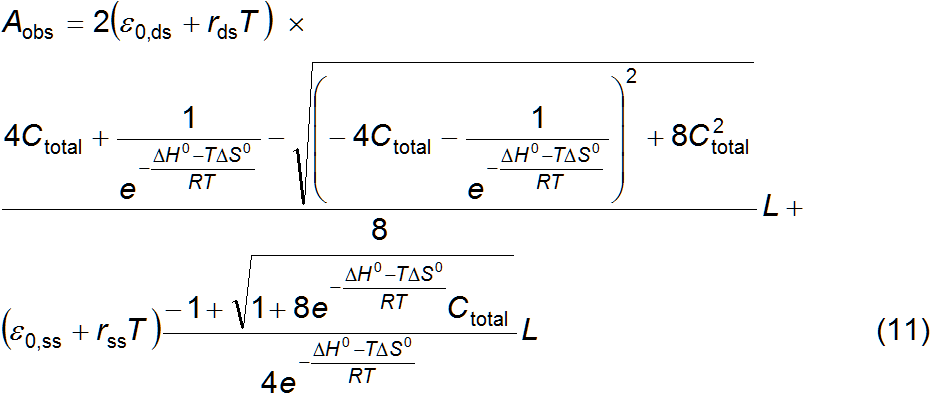
The goal is therefore to deduce an equation that relates absorbance with
temperature. Since, generally, absorbance A
is a function of each solute concentration ci
and is additive (equation 6) then the absorbance observed for a oligonucleotide
solution may be written as equation 7, where L is the light path length through the sample, εds, is the molar extinction coefficient of
paired strands and εss is the molar extinction coefficient of
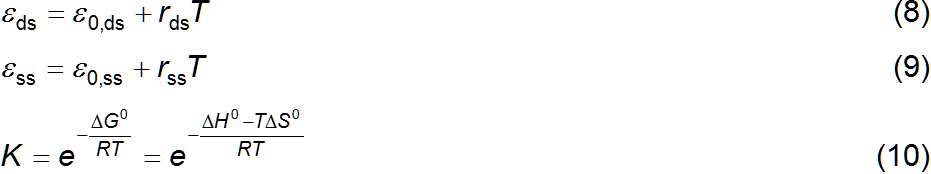
unpaired strands. These extinction coefficients (and thus A) also change with temperature, often represented as a linear
function. Equations 8 and 9 do just that for εds and εss, respectively, with parameters for zero
temperature, ε0, and the
rate of change, r. The equilibrium
constant is also a thermodynamic function of temperature, equation 10, where R is the ideal gas constant. The
parameter K is replaced by the
standard enthalpy and entropy change of equation 1, ΔH0 and ΔS0, respectively. The substitution of
equation 10 into equations 4 and 5, and of equations 4, 5, 8 and 9 into
equation 7 gives the sought for relation, equation 11, valid at equilibrium.
The parameters are ε0,ds, ε0,ss, rds, rss, ΔH0, ΔS0, L
and Ctotal. Of these,
only L and Ctotal are usually known which makes for
six adjustable parameters. Nonlinear regression of equation 11 over a data set
(A, T) enables to estimate the melting parameters, corresponding to
equation 1, for a self-complimentary oligonucleotide. It is assumed that the
thermodynamic parameters ΔH0 and ΔS0 do not change significantly with
temperature. computational function
Matlab files can be downloaded using the links
at the bottom of this page. Function melt.m
is a simple implementation of the Matlab function nlinfit.m which
estimates the parameters of equation 11 by nonlinear least squares
fitting. Also, the Matlab functions nlparci.m and
ttest.m
are used to calculate, respectively, the uncertainty
associated with the estimated parameter values and the Student-t statistic for
the residue sample against a normal distribution of samples with mean zero. The
code can be inspected with any word processor and run in the Matlab console window. The function melt.m plots the experimental points and a
line representation of the best fit of equation 10. The code can be inspected
with any word processor and run in the Matlab console
window with a command like: melt(datavariablename, [ΔH0,ΔS0,rds,ε0,ds,rss,ε0,ss], 'namestring', o); where datavariablename
is the name of a variable in the Matlab workspace
containing melting data (A, T) and the constant parameter values (see
sample file below). The second argument of melt.m is a vector of initial values for the
adjustable parameters (example: [-230000 -650 40 90000 23 115000]), and the
last argument, o, is set to 0 to just
plot the data points and the function curve using the initial parameters or to
1 to perform regression. This last option is useful to manually adjust the
initial parameter values and see the effects on the theoretical function. After
a good initial parameter vector is found by trial and error the nonlinear
fitting process is much more likely to converge. |

|
example and discussion
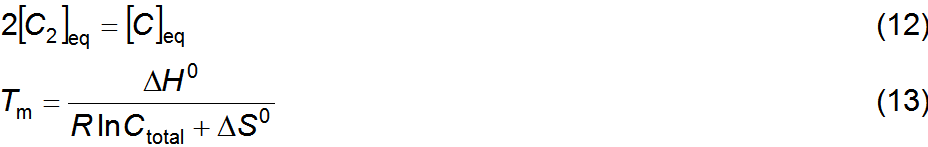
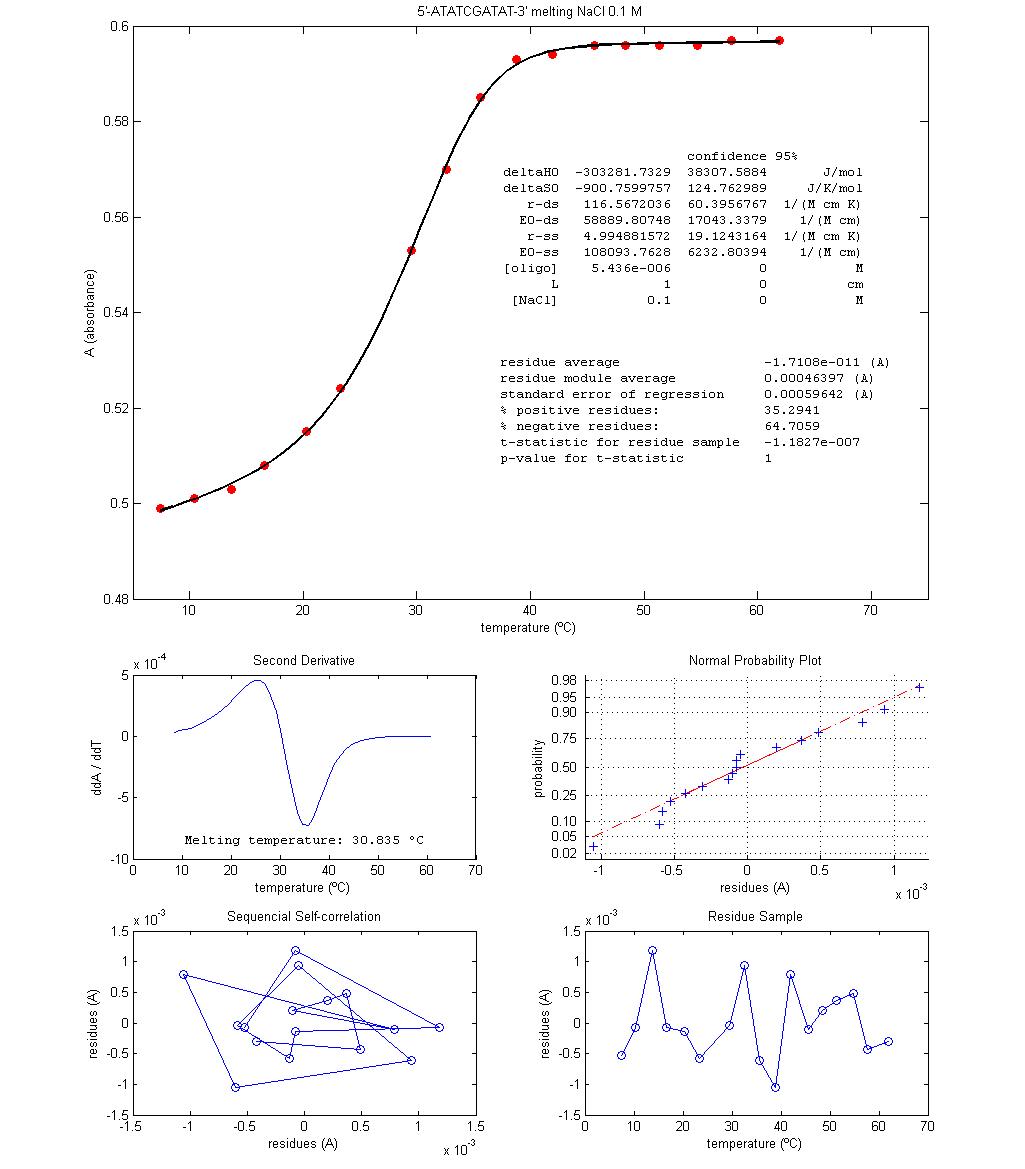
Figure 1 shows two plots
of melting data for micromolar solutions of the oligonucleotide 5'-ATATCGATAT-3' with two different NaCl concentrations. Data is approximately centred on the
melting temperatures, Tm.
These are the temperatures at which equation 12 is valid, that is, where half
of the strands are paired. Substitutions between equations 2,
3, 10 and 12 yield equation 13 for the melting temperature of a
self-complementary oligonucleotide. Students
are invited to deduce it.
Some procedures are
discussed with the students. Since the absorbance interval between experimental
temperature boundaries is not very large (less than 0.1 absorbance units), the
use of a kinetic graphical method to register absorbance stabilization when
temperature is changed enables the students with a visual way to follow
reaction re-equilibration and, at equilibrium, to take a time average of
absorbance, therefore reducing experimental errors. The procedural option of
starting the DNA melting experiment with the highest temperature is explained
as a means to make sure the oligonucleotide
population is completely unpaired at the start, independently of whatever was
its (unknown) situation at freezing or at room temperature. The experimental
process follows the direction of equation 1, that is, it is in the annealing
direction rather than in the melting direction. However, it is noted that this
is in fact an experiment where data is acquired at equilibrium,
it is not a kinetics experiment. Hence, the direction of temperature change is
irrelevant.
Discussion is focused on
the physical interpretation of signs and values of regression estimated
thermodynamic parameters, taking into account what is known about the molecular
structure of the oligonucleotide and the interactions
involved in strand pairing, namely the number of, and enthalpy change
associated with, hydrogen bond formation in water. The effect of NaCl concentration is also discussed. Since different
values for Tm and for the
thermodynamic parameters, ΔH0 and ΔS0, are obtained for
different NaCl concentrations, hypothesis for the
action mechanism of NaCl are proposed and discussed,
namely the formation of ionic pairs between Na+ and the negative
phosphates of DNA at pH 7.4. The relation between the number of data points and
the uncertainties estimates are also debated because these are quite large (Figure
1) and therefore data size should be much larger so as to reduce regression
uncertainties. Comparison between results obtained from different [NaCl] experiments is problematic when uncertainties are
that high. These propagate to Tm
through equation 13 as well.
Other ways of obtaining the oligonucleotide melting parameters [2,4] are reviewed and compared.
Figure 1 – Results from two melting
experiments done in classroom with the oligonucleotide
5'-ATATCGATAT-3' (synthesis by Stab Vida). The
solvents are pH 7.4 aqueous solution buffer of sodium phosphate with
|
references [1] http://en.wikipedia.org/wiki/Nucleic_acid_thermodynamics [2] http://www.shimadzu.com/an/uv/support/uv/ap/nucleic.html [3] D’Abramo, M., Lara,
Castellazzi, C.L., Orozco, M., Amadei,
A., On the Nature of DNA Hyperchromic
Effect, J. Phys. Chem. B 2013, 117, 8697−8704 (DOI: 10.1021/jp403369k) [4] Hull, C., Szewcyk, C., St. John, P.M., Effects of Locked Nucleic Acid Substitutions on the Stability of Oligonucleotide Hairpins, Nucleosides, Nucleotides and Nucleic Acids 2012, 31:28–41 (DOI: 10.1080/15257770.2011.639826) |
| ||||
